The team sitting second in the league visits a club in 14th place. Easy away win, right? Not necessarily. The gap in the standings tells you something about the season, but it does not tell you everything about the next 90 minutes.
For anyone studying football betting statistics, the first step is to separate a team’s reputation from its actual performance. The https://matchxi.com/table page, for example, provides a useful Premier League reference, bringing together points, matches played, goal difference and recent form. Those figures offer a starting point, but understanding what sits behind them is where the real analysis begins.
This matters particularly when examining Soccer 6, Soccer 10 or Soccer 13 pools in South Africa. With several matches to assess, one misleading favourite can change the outcome of an entire selection.
Here are seven statistics worth examining before making your next football prediction.
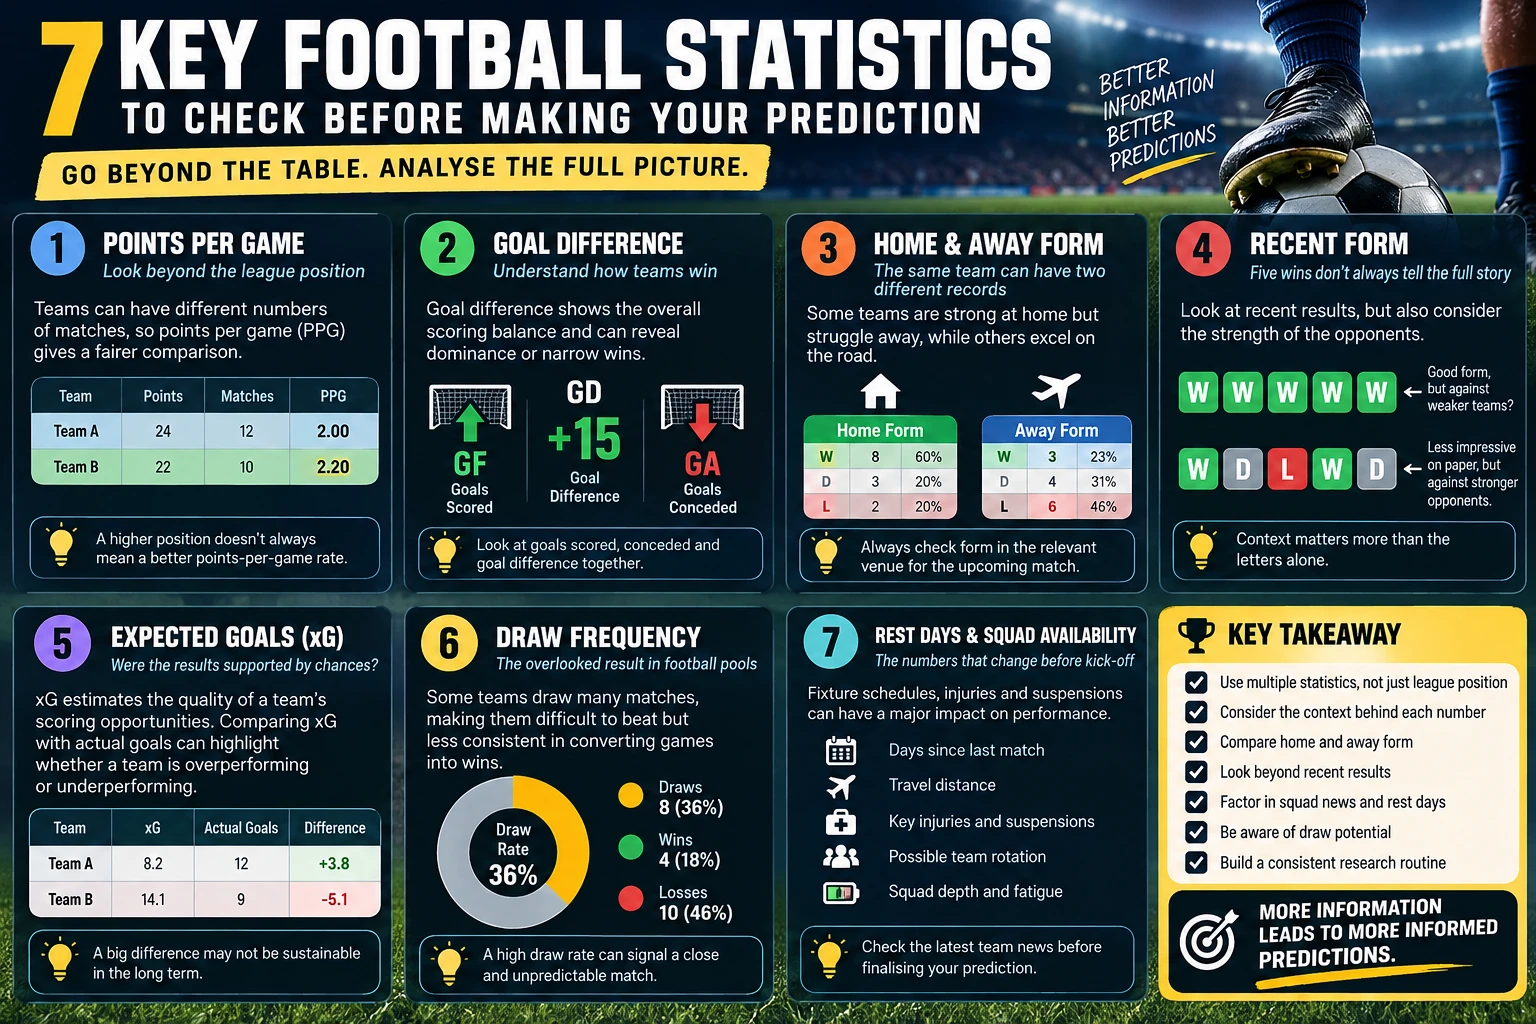
1. Points Per Game: Look Beyond the League Position
League positions can become misleading when teams have played different numbers of matches.
Imagine two clubs:
- Team A: 24 points from 12 matches.
- Team B: 22 points from 10 matches.
Team A appears stronger because it has more points. But divide the totals by matches played:
- Team A: 24 ÷ 12 = 2.00 points per game.
- Team B: 22 ÷ 10 = 2.20 points per game.
Team B has actually accumulated points at a better rate.
Points per game (PPG) is particularly useful during congested fixture periods, when postponed matches or cup commitments leave clubs with uneven schedules.
It is not a perfect measure of team strength, however. A club that has faced mostly weaker opponents may have a higher PPG than one that has already played several title contenders.
Practical lesson: Compare points per game, then examine the quality of opposition behind those results.
2. Goal Difference: Understand How Teams Win
A winning record looks impressive, but the manner of those victories matters.
Consider two teams with identical league points. One has a goal difference of +15, while the other sits at +2.
The first may have displayed greater dominance across the season. The second may have relied on narrow wins, late goals or exceptional goalkeeping performances.
Look at three numbers together:
- Goals scored (GF): How productive is the attack?
- Goals conceded (GA): How frequently does the defence allow goals?
- Goal difference (GD): What is the overall scoring balance?
For a fairer comparison between teams that have played unequal numbers of fixtures, calculate goal difference per match.
However, a single 6–0 victory can inflate the figures. Review how consistently a team scores and concedes rather than relying only on the season total.
A strong goal difference is evidence of past performance, not a guarantee of another convincing victory.
3. Home and Away Form: The Same Team Can Have Two Different Records
Some clubs look formidable in their own stadium but struggle to reproduce those performances away from home.
Others are particularly effective on the road because their tactical approach suits counterattacking football.
That distinction is easy to overlook when analysing the overall standings.
A team might occupy fourth position thanks to excellent home results while collecting relatively few points on its travels.
When evaluating an upcoming fixture, check:
- Points per game at home and away.
- Goals scored and conceded in the relevant venue.
- Recent performances against similarly ranked opponents.
- Whether the team relies on possession or prefers counterattacks.
For soccer pool predictions, these differences can be more informative than the gap between league positions.
A top-four club travelling to a well-organised mid-table opponent may face a much tougher contest than the overall table suggests.
4. Recent Form: Five Wins Do Not Always Tell the Full Story
Most football websites display form using familiar letters: W for a win, D for a draw and L for a defeat.
The sequence W-W-W-W-W looks outstanding.
But what if all five victories came against struggling opponents?
Now consider another club showing W-D-L-W-D after facing several of the league’s strongest teams.
Which record is more impressive?
The answer requires context.
Recent form should be evaluated alongside opponent strength, match location and the performances themselves. A narrow defeat against the league leaders may reveal more about a team’s competitiveness than a comfortable victory against the bottom club.
The league table tells you what a team has earned. Good match analysis asks how those points were earned — and whether the same conditions will exist next weekend.
Avoid treating recent form as a prediction machine. It describes what happened, not what must happen next.
5. Expected Goals: Were the Results Supported by Chances?
Expected goals, usually abbreviated as xG, attempt to estimate the quality of scoring opportunities a team creates.
A shot from close range generally carries a higher expected-goal value than a speculative effort from 30 metres.
When reliable xG data is available, compare it with actual goals scored and conceded.
For example, a team that has scored 12 goals from chances worth approximately eight expected goals may have enjoyed an unusually productive finishing period.
That does not mean its next match will produce fewer goals. It simply raises an important question: can that finishing efficiency be sustained?
Similarly, a club that creates high-quality chances but repeatedly fails to score may be performing better than its league position suggests.
Expected goals are model-based estimates, and different providers may calculate them differently. Use a consistent source and avoid treating xG as an exact forecast.
6. Draw Frequency: The Overlooked Result in Football Pools
When reviewing a list of fixtures, many people immediately search for the strongest home and away teams.
Draws can receive less attention.
Yet a team with a high number of draws may have a particular playing style: difficult to beat, defensively organised, but not especially clinical in attack.
For example, two sides might both have collected 20 points, but through different records:
- Team A: six wins, two draws and six defeats.
- Team B: four wins, eight draws and two defeats.
Both have 20 points from 14 matches, yet their results tell very different stories.
Team B has lost fewer games but has also converted fewer matches into victories.
Draw percentage provides a useful historical indicator:
Draw rate = Draws ÷ Matches played × 100
A high draw rate does not make a draw inevitable in the next fixture. Instead, it signals that a closer examination of scoring patterns, tactical matchups and the opponent’s style may be worthwhile.
7. Rest Days and Squad Availability: The Numbers That Change Before Kick-Off
Some of the most important information is missing from traditional league tables.
Consider a club that played a demanding European fixture on Thursday evening and faces another match on Sunday.
Its league position has not changed. Its season-long goal difference is still the same.
But the conditions surrounding the next match are different.
Players may be fatigued, the manager may rotate the starting XI, and injured or suspended footballers may be unavailable.
Before finalising a match assessment, check:
- How many days each team has had since its previous fixture.
- Whether either club has travelled long distances.
- Which first-team players are unavailable.
- Whether the manager is likely to rotate the squad.
- Whether the competition schedule gives one team a meaningful recovery advantage.
Treat these factors as context rather than automatic penalties. A club with substantial squad depth may handle a busy schedule better than a team with fewer reliable substitutes.
Quick Reference: Which Football Betting Statistics Matter Most?
Not every number deserves equal attention. The following table summarises the seven indicators and the mistakes they can help identify.
| Statistic | What it reveals | Common mistake |
|---|---|---|
| Points per game | Points earned relative to matches played | Comparing raw points with unequal schedules |
| Goal difference | Overall scoring balance | Ignoring unusually large wins |
| Home/away form | Performance in the relevant venue | Using the overall record only |
| Recent form | Short-term results | Ignoring opponent quality |
| Expected goals | Quality of chances created and conceded | Treating xG as a guaranteed forecast |
| Draw percentage | Historical frequency of stalemates | Assuming the favourite must win |
| Rest and availability | Matchday conditions | Relying on outdated team information |
The goal is not to collect the greatest number of statistics. It is to identify which ones are relevant to the specific fixture.
A Practical Example: When the Favourite Deserves a Second Look
Imagine a hypothetical match between Northbridge FC and Coast City.
Northbridge are third in the league, while Coast City are seventh.
A quick glance at the standings suggests Northbridge should be favourites.
Now consider the wider picture.
Northbridge have collected 24 points from 12 matches, while Coast City have 22 from the same number of fixtures. Their points-per-game figures are 2.00 and 1.83 respectively — a real but relatively small difference.
Northbridge have won four of their last five matches, but three of those victories came against clubs near the bottom of the table.
Coast City have won only three of their last five, although their opponents included two title contenders.
Northbridge have also played twice in the previous seven days, while Coast City have enjoyed a full week of preparation.
Does this make Coast City the better selection?
Not automatically.
What it means is that the league positions alone do not justify an overwhelming level of confidence in Northbridge.
The next step would be to examine home and away records, possible team changes, attacking performance and the available pre-match information.
This is precisely where statistical analysis becomes useful: it reveals uncertainty that a simple league ranking can hide.
How to Build a Repeatable Pre-Match Research Routine
A consistent method is more useful than changing your approach whenever a surprising result occurs.
For each fixture, follow five steps:
- Establish the baseline. Record each team’s points per game, goal difference and league position.
- Check the venue. Compare the home team’s home record with the away team’s away record.
- Review recent opponents. Identify whether current form has been achieved against strong or weak competition.
- Check matchday conditions. Review injury news, suspensions, likely lineups and rest periods.
- Record your uncertainty. Distinguish fixtures with several supporting indicators from those with conflicting evidence.
For multi-match soccer pools, repeat the process across the coupon rather than spending all your research time on one high-profile fixture.
It can also help to record your pre-match reasoning and compare it with the final result. Over time, this allows you to examine whether particular indicators have actually improved your assessments or merely reinforced your original assumptions.
Why More Statistics Do Not Automatically Mean Better Predictions
There is a temptation to add more and more metrics to every match preview.
Possession percentages, shots on target, corner counts, head-to-head records and dozens of advanced measurements can all appear useful.
But a statistic matters only when it helps answer a relevant question.
For example, a team averaging high possession may still struggle to create dangerous opportunities. A club that wins many corners may not be particularly effective at converting them into goals.
Head-to-head results can also be misleading when they involve different managers, playing styles and squads.
The important distinction is between information that describes previous matches and evidence that may genuinely help explain the upcoming fixture.
Good football betting analysis uses statistics to challenge assumptions, not to manufacture certainty.
Final Thoughts: Start With the Table, Then Look Deeper
League standings remain one of the most useful starting points in football analysis. They provide an immediate picture of results, points, scoring records and the overall competitive landscape.
But they should never be the entire argument for a prediction.
Points per game can expose misleading rankings. Goal difference can reveal contrasting levels of dominance. Home and away records, recent opposition, expected goals and squad availability can add essential context.
For South African soccer pool followers, the most useful habit is to examine each match on its own merits rather than automatically choosing the highest-ranked team.
Football will always produce unexpected results. Statistics cannot remove that uncertainty, but they can help readers understand the assumptions behind a forecast and recognise when the evidence is less convincing than the league table first suggests.
Responsible play: Football predictions are uncertain, and no statistical method guarantees a winning outcome. Gambling is intended for adults aged 18 and over. Never risk money you cannot afford to lose.
Disclaimer:
Sports are unpredictable by nature. No analyst can guarantee 100% accurate results.
We use statistics, team form, and analytics to increase the likelihood of accurate predictions. However, the final outcome depends on thousands of factors – many of which are unforeseeable.
The materials on this site are not a call to betting and are not affiliated with any bookmakers or national lotteries.
This resource is created solely for informational and entertainment purposes.
All information published here may change without notice. We do not take responsibility for any decisions made based on it.
Before placing any bets, always check current odds and team status.
Remember: gambling may lead to addiction. Do not risk money you cannot afford to lose.
If you or someone close to you needs help – contact the South African Responsible Gambling Foundation:
Free support – 006 008 or SMS “HELP” to 076 675 0710
helpline@responsiblegambling.org.za
By using this site, you agree that all information is for reference only and any risks are your own responsibility.

ProSoccerTips
About meProSoccerTips brings you straight-up football tips from folks who live and breathe the game. Every day, we dig into stats, matchups, team form and more to help you make smarter bets - no guesswork, just proper football insight. Whether it’s local leagues or big-name clashes, we’ve got your back with tips you can trust. We check everything - form, injuries, even the weather - so you don’t have to. Stick with us, follow the updates, and let’s chase those wins together!